
Plot Shape Differences
Mark A. Conaway
Introduction
Functions like plotAllSpecimens allow the user to
visualize shape variance within an entire set of specimens. If one
wishes to visualize the shape differences between just two sets of
coordinates - say, between the mean shape of a dataset, and another
specimen of interest - one can use plotRefToTarget.
plotRefToTarget()
- \(M1\): Matrix of landmark
coordinates for the first (reference) specimen. A common choice here
would be the mean shape of a set of specimens, accessed from a gpagen
object with the operator
$consensus.- \(M2\): Matrix of landmark coordinates for the second (target) specimen.
- \(mesh\): A mesh3d object for use with method=“surface”. See read.ply for more information.
- \(outline\): An x,y curve or curves warped to the reference (2D only)
- \(method\): Method used to visualize shape difference (the type of plot); see below for details.
- \(mag\): The desired magnification to be used when visualizing the shape difference (e.g., mag=2).
- \(links\): An optional matrix defining for links between landmarks
- \(label\): A logical value (TRUE or FALSE) indicating whether landmark numbers will be plotted
- \(axes\): A logical value indicating whether the box and axes should be plotted (points and vector only)
- \(useRefPts\):
Method: TPS
This method generates a thin-plate spline (TPS) deformation grid. Can be used for 2D or 3D data. For 3D data, deformations will be generated in both the xy and xz planes. For this, and each of the following examples, we compare the first specimen in our data set to the mean shape.
plotRefToTarget(GPApleth$consensus, GPApleth$coords[,,1], links = links, method = "TPS")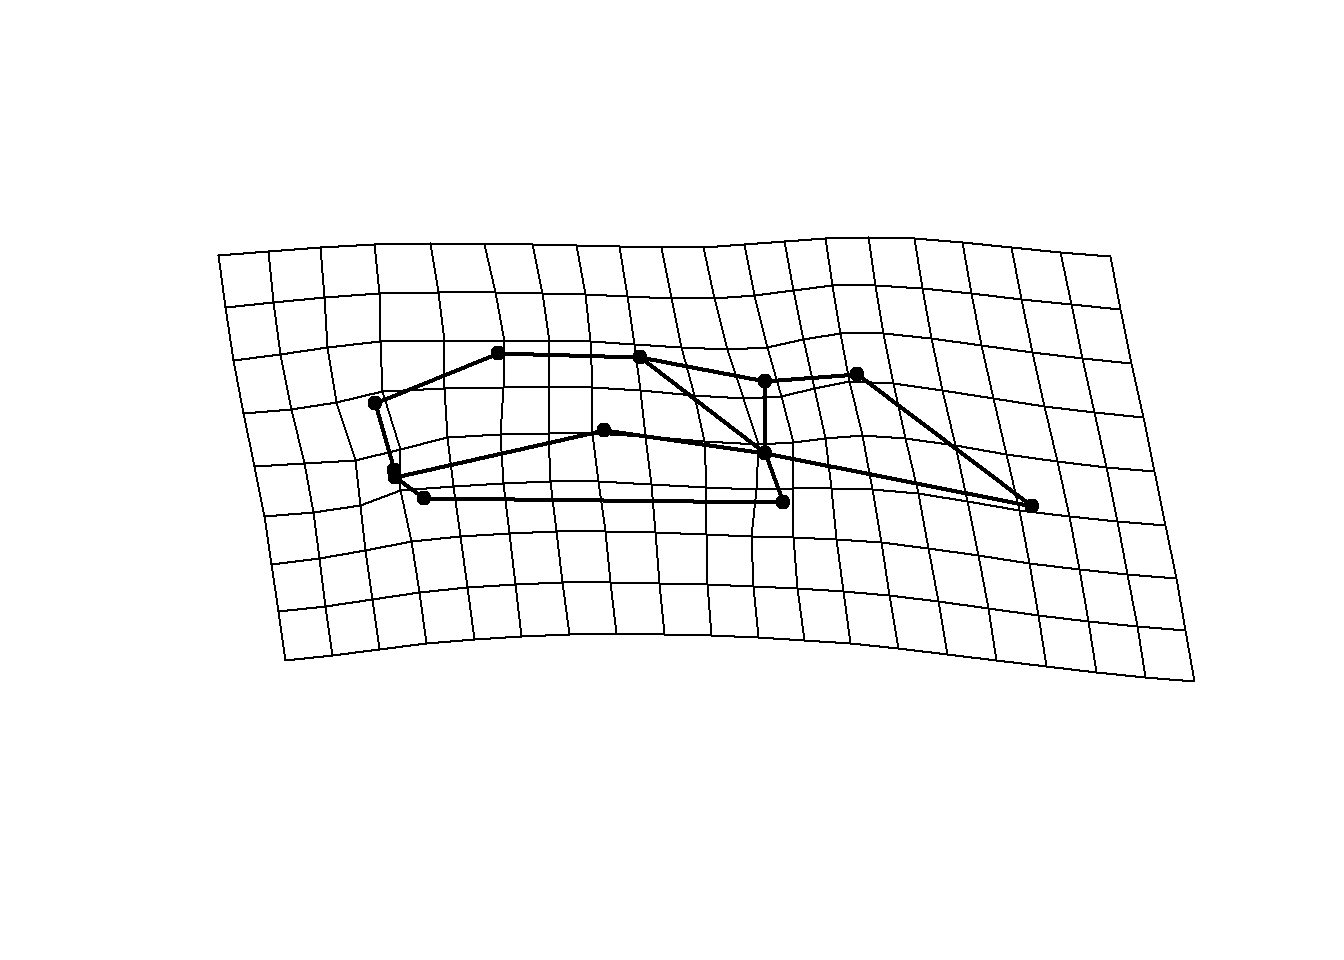
Method: vector
The vector show method, shows displacements in morphospace between corresponding landmarks in the reference (M1) and target (M2) specimen.
plotRefToTarget(GPApleth$consensus, GPApleth$coords[,,1], links = links, method = "vector")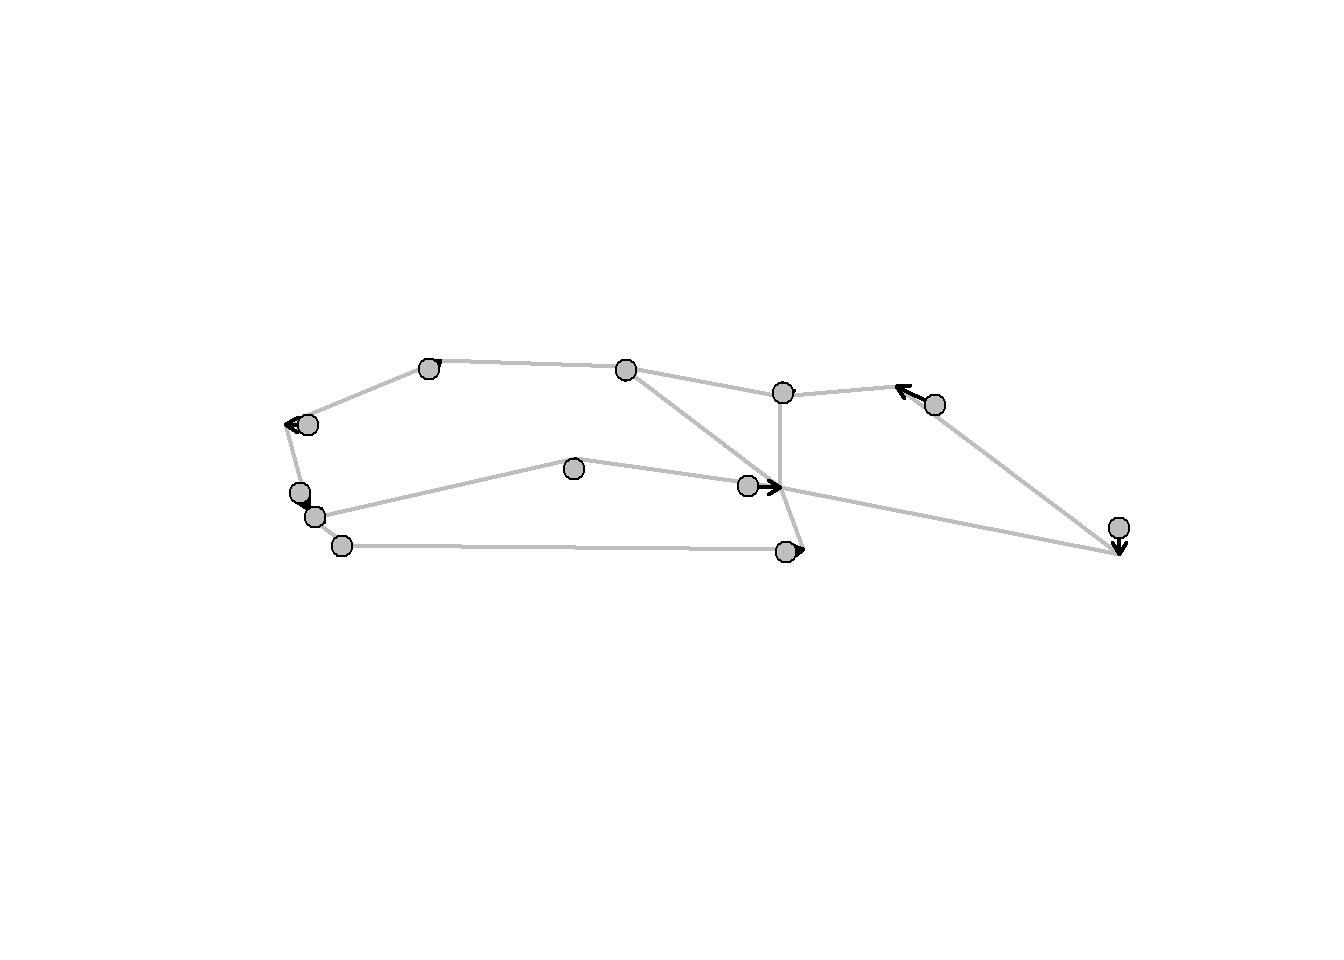
Method: points
This method plots landmarks of the target specimen on top of those of the reference. By default, the reference shape will be plotted in black.
plotRefToTarget(GPApleth$consensus, GPApleth$coords[,,1], links = links, method = "points")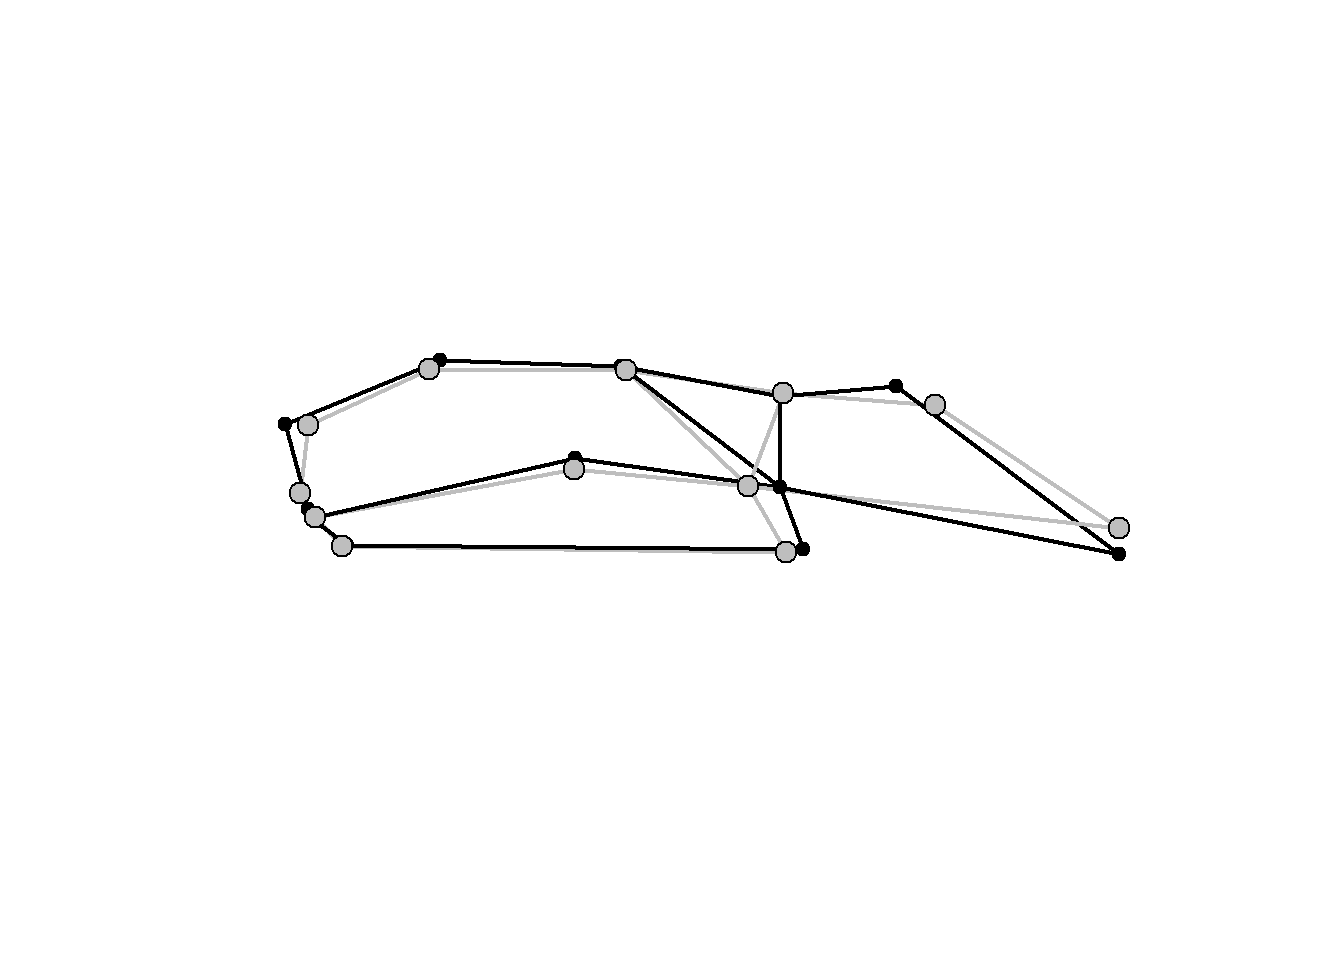
Method: surface
An input mesh3d object is warped using thin-plate spline. This illustrates shape differences between the reference and target specimen using a 3D object.
plotRefToTarget(GPAscal$consensus, GPAscal$coords[,,1], mesh = mesh, method = "surface")