
Geomorph Data Types
Morphometric analyses in geomorph are frequently
performed on two-dimensional or three-dimensional landmark data.
However, other types of data can be analyzed using functions found in
geomorph, and therefore there are multiple data structures
that the user should be familiar with.
Three-dimensional Arrays
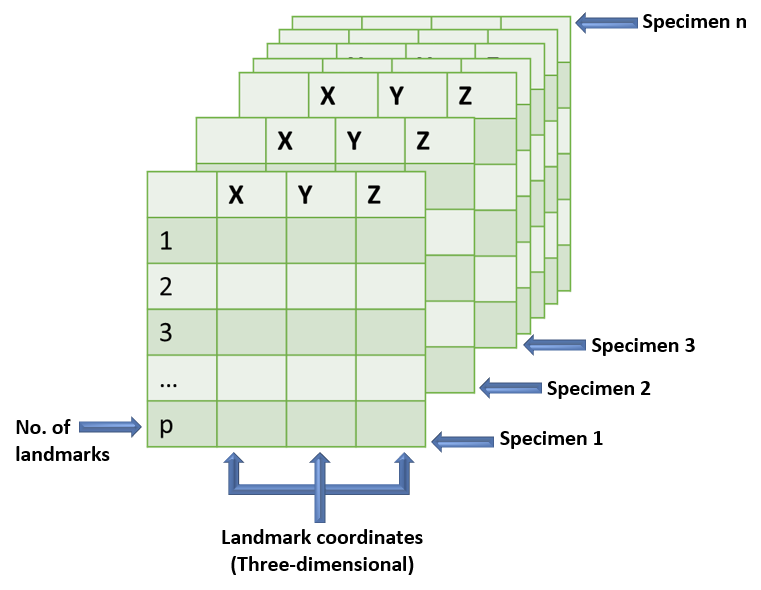
One of the most common data types used in geomorph
functions is the three-dimensional array. This is a volumetric matrix,
meaning that it contains multiple distinct specimens - with the
possibility of attaching names to those specimens - as well as landmark
data. This is best illustrated as a stack of cards, as shown in Figure
1. Each specimen (card) is a matrix containing \(p\) landmarks in three dimensions (x, y,
z). The array itself consists of nested \(n\) specimens, that can be accessed
separately, or acted upon collectively. For more information on this
data type, visit the All About Arrays tutorial.
Two-dimensional Matrix
Some functions in geomorph can also be run with landmark
data in a 2D matrix format. In terms of structure, a 2d matrix is a
matrix of \(n\) rows and \(p x k\) columns, as if all of the specimen
“cards” that are stacked in a 3D array (Figure 1) are laid out next to
one another in a single horizontal line. Therefore, each row of a 2D
matrix contains coordinates for \(one\)
\(landmark\) for every specimen in the
dataset. To put it another way, the first three columns of a 2D matrix
contain the xyz coordinates of each three-dimensional landmark (by row)
of the first specimen in a dataset. This format is most useful, however,
when one wishes to incorporate other morphological data aside from
landmarks. Data (including 3D arrays) can be coerced into this format
with the function two.d.array, and will not
impede the function of geomorph stats functions. However,
it is important to note that data in this format cannot be used for shape visualization in geomorph.
Geomorph Shapes
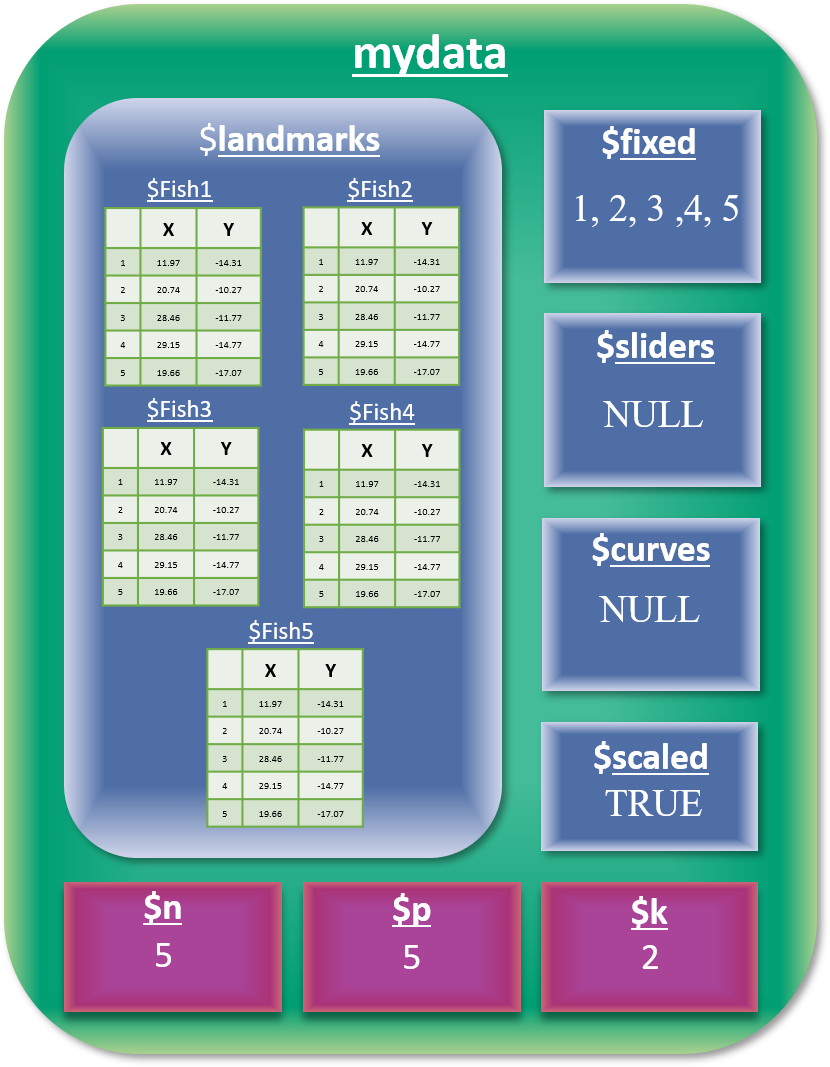
Another commonly used data type in geomorph is the
geomorphShapes file. This is a list-like object, that can be created
using the function readlandShapes. A single
geomorphShapes file contains (Figure 2, left): landmark coordinates for
a set of specimens ($landmarks), as well as information on
the number of specimens ($n), the number of landmarks
($p), and the number of dimensions ($k).
Additionally, if semilandmarks are included in the dataset, a
geomorphShapes object includes identifiers of fixed
($fixed) and sliding ($sliders) landmarks. If
there are no sliders in the data, the latter of these will have a value
of NULL. If there are semilandmark curves in the dataset, a
matrix identifying the sliding and anchor points of each curve is
included ($curves). This matrix is used in conjunction with
the gpagen function to perform semilandmark
sliding. Finally, a logical (TRUE/FALSE) value to indicate whether
landmarks have been scaled can be accessed via $scaled.
Each of these subsets of a geomorphShapes object can be accessed using
the $ operator.