
Modularity via CR Coefficient
Mark A. Conaway
Introduction
While an analysis of morphological integration allows one to assess the degree of association (covariance) among sets of phenotypic traits, it is in related studies of modularity where one can begin to decipher the extent to which groups of traits are more or less independent from other such groups. Modularity, therefore is a vital consideration when one is concerned with the evolution of novelty (Adams & Collyer 2019). More technically, modularity is a relative measure of covariance. In an analysis of modularity, given two or more sets of traits, we ask: is covariance among the traits within each of those sets weaker or stronger than the covariance among each of the sets of traits.
In geomorph, modularity can be quantified with the
modularity.test function. This function quantifies the
degree of modularity, via the CR Coefficient (Adams 2016) between two or
more hypothesized modules of Procrustes shape variables. The CR
coefficient for the observed modular hypothesis is then compared to a
distribution of values obtained by randomly assigning landmarks into
subsets, with the restriction that the number of landmarks in each
subset is identical to that observed in each of the original partitions.
A significant modular signal is found when the observed CR coefficient
is small relative to this distribution (see Adams 2016). Such a result
implies that there is significantly greater independence among modules
than is expected under the null hypothesis of random associations of
variables (neither modular nor integrated structure).
modularity.test()
- \(A\): A 3D array (p x k x n) containing Procrustes shape variables for all specimens, or a matrix (n x variables)
- \(partition.gp\): A list of which landmarks (or variables) belong in which partition: (e.g. A, A, A, B, B, B, C, C, C)
- \(iter\): Number of iterations for significance testing
- \(CI\): A logical argument indicating whether bootstrapping should be used for estimating confidence intervals
- \(seed\): An optional argument for setting the seed for random permutations of the resampling procedure. If left NULL (the default), the exact same P-values will be found for repeated runs of the analysis (with the same number of iterations). If seed = “random”, a random seed will be used, and P-values will vary. One can also specify an integer for specific seed values, which might be of interest for advanced users.
- \(opt.rot\): A logical argument for whether the optimal rotation for CR should be used for landmark data (default = TRUE)
- \(print.progress\): A logical value to indicate whether a progress bar should be printed to the screen. This is helpful for long-running analyses.
Example of Analysis
Our input for this function should be a 3D array containing previously aligned Procrustes coordinates. Similarly to the integration.test we must identify \(a priori\) partitions of these landmarks:
land.gps<-rep('a',56); land.gps[39:48]<-'b'This vector will identify landmarks 1-38 and 49-56 as belonging to one \(a priori\) partition (a), whose covariance will be compared to the second partition of landmarks 39-48 (b).
MT <- modularity.test(lmks$coords,land.gps,CI=FALSE,iter=99, print.progress = F)Like other shape pattern functions in geomorph, results
can be summarized and visualized using the base R functions
summary and plot, respectively. In addition, a
multivariate effect size describing the strength of the effect is
estimated from the empirically-generated sampling distribution (see
details in Adams and Collyer 2019). A histogram of coefficients obtained
via resampling is presented, with the observed value designated by an
arrow in the plot.
summary(MT)
plot(MT)
##
## Call:
## modularity.test(A = lmks$coords, partition.gp = land.gps, iter = 99, CI = FALSE, print.progress = F)
##
##
##
## CR: 0.908
##
## P-value: 0.02
##
## Effect Size: -2.145
##
## Based on 100 random permutations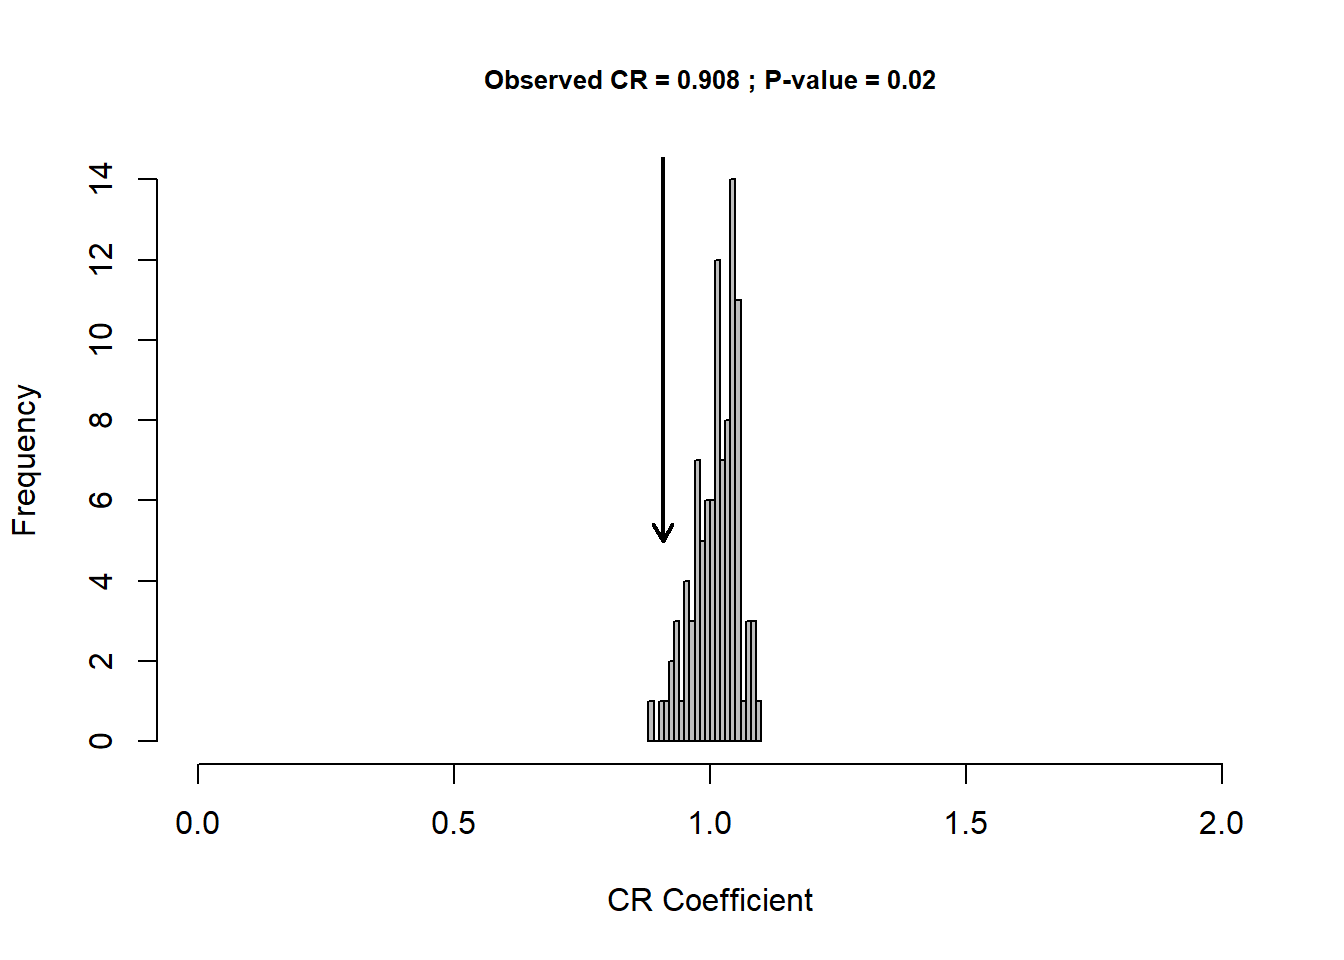
This function returns an object of class “CR”, which is a list containing the following:
modularity.test output
- \(CR\): Covariance ratio: The estimate of the observed modular signal.
- \(CInterval\): The bootstrapped 95 percent confidence intervals of the CR, if CI = TRUE.
- \(CR.boot\): The bootstrapped CR values, if CI = TRUE
- \(P.value\): The empirically calculated P-value from the resampling procedure.
- \(Effect.Size\): The multivariate effect size associated with sigma.d.ratio.
- \(CR.mat\): For more than two partitions, the pairwise CRs among partitions.
- \(random.CR\): The CR calculated in each of the random permutations of the resampling procedure.
- \(permutations\): The number of random permutations used in the resampling procedure.
- \(call\): The match call (input code).