
Integration via Singular Warp Analysis
Mark A. Conaway
Introduction
One potential avenue for quantifying the degree of morphological
integration among sets of traits is to assess their covariance. This can
be done with a two-block partial least squares analysis (PLS). However,
in the context of integration studies, this is referred to as a Singular
Warp Analysis. Similar to the two.b.pls function, the
integration.test function in geomorph allows the user to
perform a PLS/Singular Warp analysis, but in this case for the specific
purpose of assessing morphological integration among modular partitions
of Procrustes coordinates. An added feature of
integration.test is that the user may include more than two
sets of variables for analysis.
Important Note! When performing analyses with only
two sets of variables, results will be identical to those returned by
two.b.pls.
integration.test()
- \(A1\): A 3D array (p x k x n) containing Procrustes shape variables for the first block, or a matrix (n x variables)
- \(A2\): A 3D array (p x k x n) containing Procrustes shape variables for the second block, or a matrix (n x variables)
- \(partition.gp\): A list of which landmarks (or variables) belong in which partition: (e.g. A, A, A, B, B, B, C, C, C). Required when only 1 dataset provided.
- \(iter\): Number of iterations for significance testing
- \(seed\): An optional argument for setting the seed for random permutations of the resampling procedure. If left NULL (the default), the exact same P-values will be found for repeated runs of the analysis (with the same number of iterations). If seed = “random”, a random seed will be used, and P-values will vary. One can also specify an integer for specific seed values, which might be of interest for advanced users.
- \(print.progress\): A logical (TRUE/FALSE) value to indicate whether a progress bar should be printed to the screen. This is helpful for long-running analyses.
Example of Analysis
When using this function, one can input data in one of two ways.
Firstly, the user can simply input a separate object for each block of
data. Alternatively, however, the user can input a single object
containing all Procrustes coordinates, and subsequently define, or
partition, the separate blocks within that object using a vector. With
two blocks of data, the function can be used similarly to
two.b.pls:
lmkpart <- c("A","A","A","A","A","B","B","B","B","B","B","B")
IT <- integration.test(lmks$coords, partition.gp=lmkpart, iter=999, print.progress = F)
summary(IT)
##
## Call:
## integration.test(A = lmks$coords, partition.gp = lmkpart, iter = 999, print.progress = F)
##
##
##
## r-PLS: 0.911
##
## Effect Size (Z): 5.2379
##
## P-value: 0.001
##
## Based on 1000 random permutationsResults can likewise be plotted using the base R plot function
plot(IT)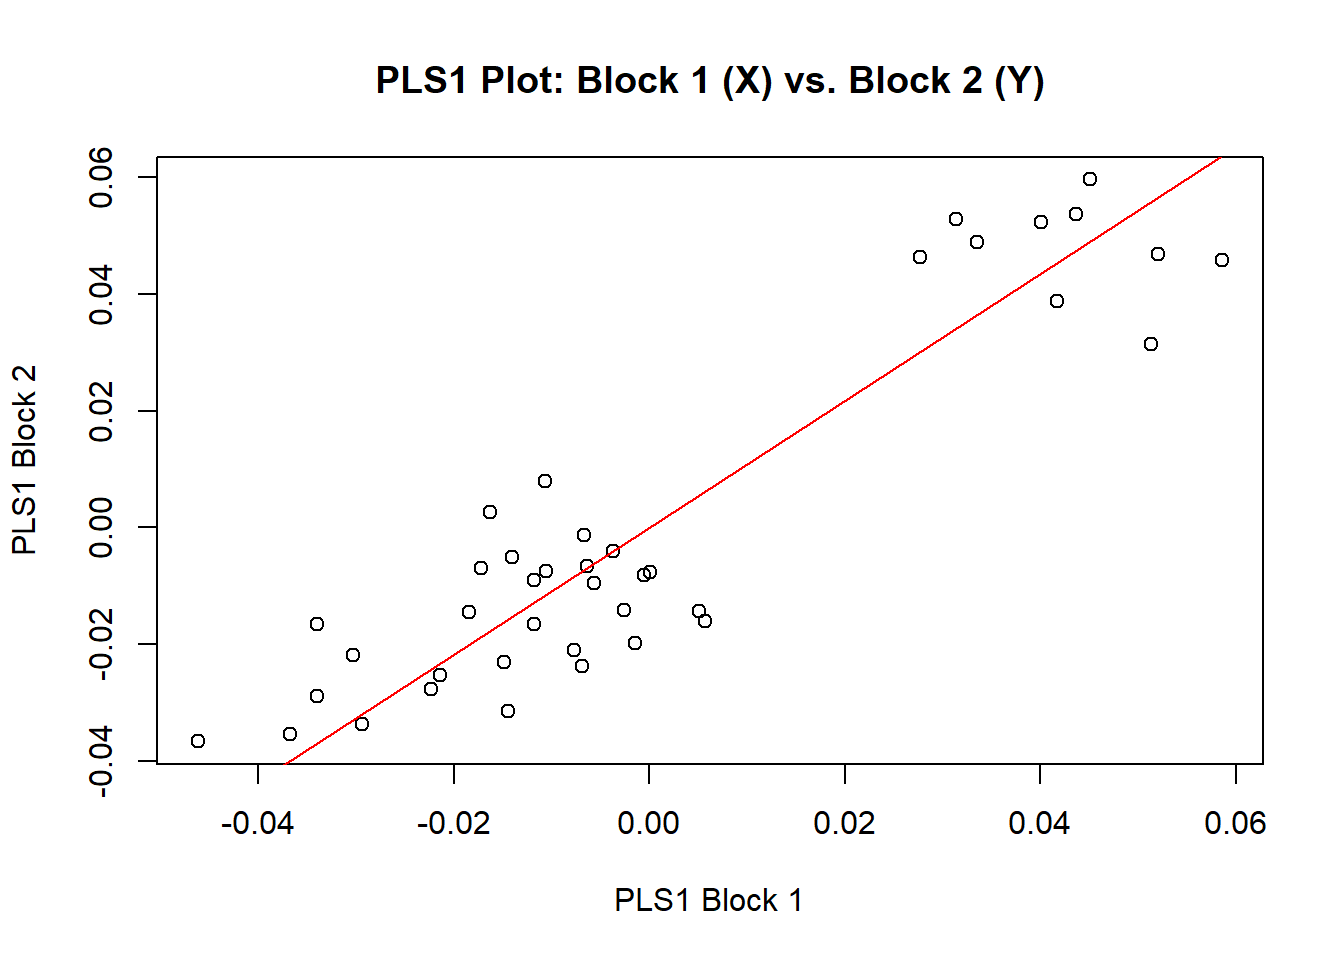
Alternatively, we can define a third partition in our input file:
lmkpart2 <- c("A","A","A","A","B","B","B","B","C","C","C","C")
IT2 <- integration.test(lmks$coords, partition.gp=lmkpart2, iter=999, print.progress = F)
When we summarize the results, we get summary statistics for each pairwise combination of blocks:
summary(IT2)##
## Call:
## integration.test(A = lmks$coords, partition.gp = lmkpart2, iter = 999, print.progress = F)
##
##
##
## r-PLS: 0.833
##
## Effect Size (Z): 7.1137
##
## P-value: 0.001
##
## Based on 1000 random permutations
##
## Pairwise statistics
##
## r-PLS:
## A B
## B 0.8241683
## C 0.8688972 0.8050437
##
## Effect Sizes (Z):
## A B
## B 4.672351
## C 5.049257 4.428199
##
## P-values::
## A B
## B 0.001
## C 0.001 0.001Note also that the initial r-PLS value is the average value for all blocks of data included in the analysis.
integration.test Output
This function returns an object of class “pls” that contains the following values, each of which can be accessed with the $ operator.
- \(r.pls\): The correlation coefficient between scores of projected values on the first singular vectors of left (x) and right (y) blocks of landmarks (or other variables). This value can only be negative if single variables are input, as it reduces to the Pearson correlation coefficient.
- \(P.value\): The empirically calculated P-value from the resampling procedure.
- \(Effect.Size\): The multivariate effect size associated with sigma.d.ratio.
- \(left.pls.vectors\): The singular vectors of the left (x) block
- \(right.pls.vectors\): The singular vectors of the right (y) block
- \(random.r\): The correlation coefficients found in each random permutation of the resampling procedure.
- \(XScores\): Values of left (x) block projected onto singular vectors.
- \(YScores\): Values of right (y) block projected onto singular vectors.
- \(svd\): The singular value decomposition of the cross-covariances.
- \(A1\): Input values for the left block.
- \(A2\): Input values for the right block.
- \(A1.matrix\): Left block (matrix) found from A1.
- \(A2.matrix\):Right block (matrix) found from A2.
- \(permutations\): The number of random permutations used in the resampling procedure.
- \(call\): The match call.
Important Note! If one wishes to incorporate a phylogeny in a PLS analysis, please see the tutorial for the phylo.integration function.