
GPA with curve semilandmarks
Performing a GPA with sliding semilandmarks on curves
Data are input in a similar fashion when performing a GPA with
sliding semilandmarks, with one exception. In order for semilandmark
sliding to occur, the gpagen function requires a ‘sliders
matrix’ identifying which landmarks are to be treated as (sliding)
semilandmarks. Landmarks listed in this matrix are designated as sliding
semilandmarks: those not listed are treated as fixed landmarks. Using
this simple system, one can therefore have a combination of both fixed
and sliding semilandmarks in an analysis. In the example below,
landmarks 11-25 are designated as sliding semilandmarks, meaning that
landmarks 1-10 are treated as fixed:
data(hummingbirds)
hummingbirds$curvepts
## before slide after
## [1,] 1 11 12
## [2,] 11 12 13
## [3,] 13 14 15
## [4,] 7 15 14
## [5,] 12 13 14
## [6,] 1 16 17
## [7,] 16 17 18
## [8,] 17 18 19
## [9,] 18 19 20
## [10,] 10 20 19
## [11,] 2 21 22
## [12,] 21 22 23
## [13,] 22 23 24
## [14,] 23 24 25
## [15,] 8 25 24In the above matrix, the middle column ‘slide’ lists the landmark numbers for those landmarks that will slide. The ‘before’ and ‘after’ columns indicate the anchor points for each slider. For example, the above matrix indicates that landmark 11 should slide between landmarks 1 and 12.
This matrix is specified under the curves argument as
shown here:
GPA <- gpagen(hummingbirds$land, curves = hummingbirds$curvepts,
              approxBE = TRUE, print.progress = FALSE)
plotAllSpecimens(GPA$coords)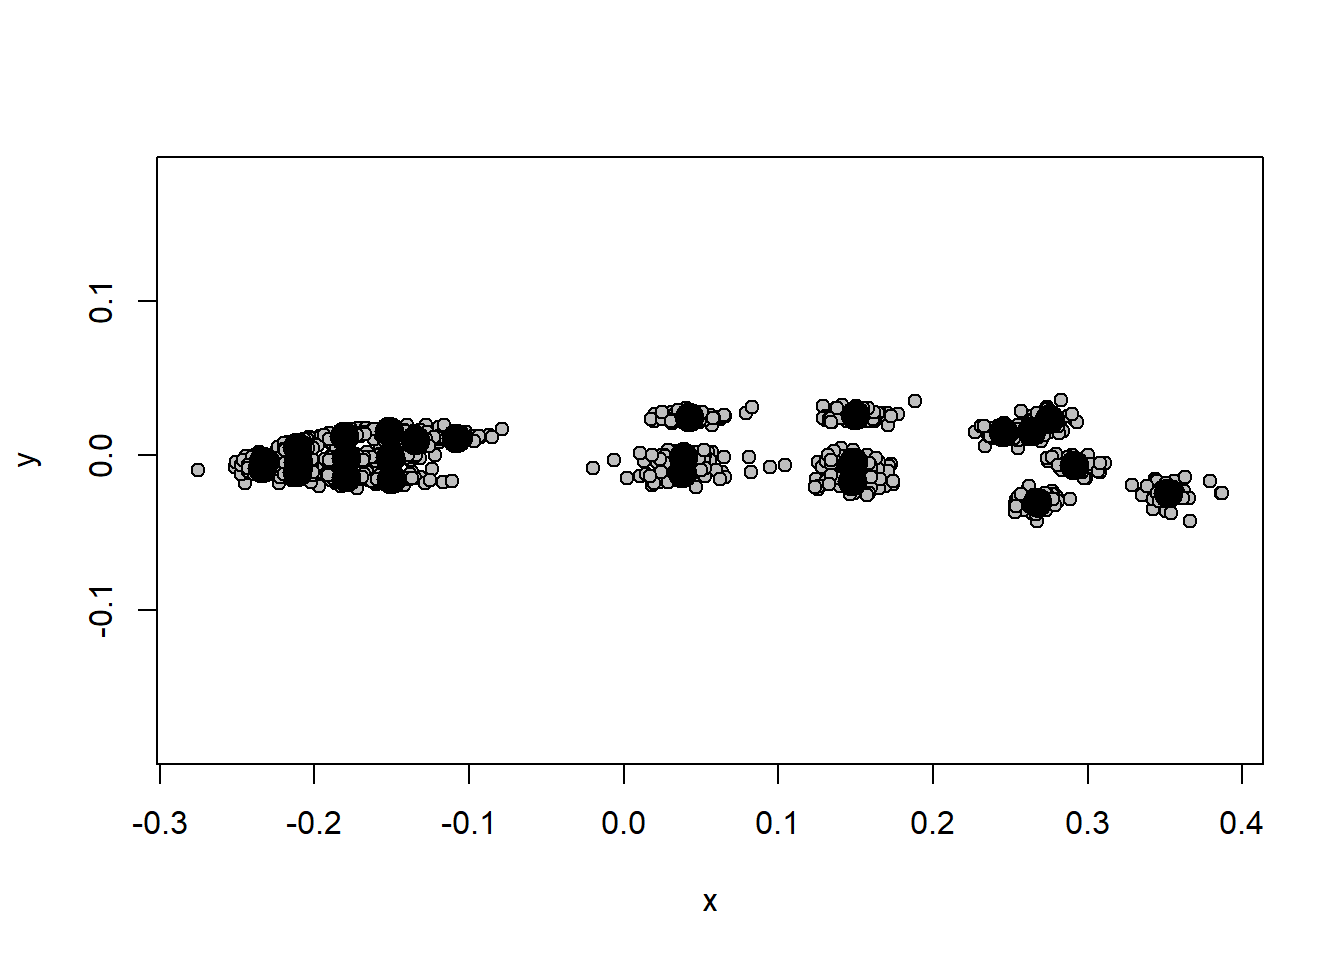
The example slider matrix above is included as part of the
hummingbirds dataset embedded in geomorph.
However you can also create a sliders matrix in R using the function
define.sliders:
Sliders <- define.sliders(1:10)
Sliders
## before slide after
## [1,] 1 2 3
## [2,] 2 3 4
## [3,] 3 4 5
## [4,] 4 5 6
## [5,] 5 6 7
## [6,] 6 7 8
## [7,] 7 8 9
## [8,] 8 9 10The result of the above code will be a curve of 10 landmarks, where landmarks 2-9 slide relative to each other and to the anchor points of landmarks 1 and 10.
This code can be adjusted to identify multiple curves as well:
Sliders <- rbind(define.sliders(1:5), define.sliders(6:10))
Sliders
## before slide after
## [1,] 1 2 3
## [2,] 2 3 4
## [3,] 3 4 5
## [4,] 6 7 8
## [5,] 7 8 9
## [6,] 8 9 10The above code identifies two separate curves, each of 5 landmarks. Here, landmarks 2, 3, and 4 slide between landmarks 1 and 5; and landmarks 7, 8, and 9, slide between landmarks 6 and 10.